- Published on
BA024. The Evolution of EXAWin Bayesian Engine: The Day Data Tuned Its Own Parameters
Six months since the EXA Bayesian Engine (BA020) lifted the fog from sales win probabilities (BA020. The Invisible Hand of Sales: A 60-Day Gamble). The VP of Sales had come to trust the system's judgment, and the team had grown accustomed to data-driven decision-making. But as deals piled up and time passed, he found himself confronting an uncomfortable truth — the engine's 'initial settings' were still the ones he had punched in by gut instinct.
This is the story of the moment a sales engine evolved from 'human intuition' to 'self-learning from data.' Its name is Auto-Tuner.
Chapter 1. The Crack
It was a Friday afternoon in March, rain tapping against the office windows.
The VP of Sales — now known in-house as 'the pioneer of data-driven selling' — had just returned from the quarterly review. His expression was grim. Barely thirty minutes had passed since his confident presentation to the CEO, but something was gnawing at him.
After the EnergyA project's success, twelve more deals had run through the system. Results? Eight wins, four losses. A 67% success rate. Not bad. But the problem wasn't the successes — it was the failures.
In three of the four lost deals, the system had shown win probabilities above 60% right up to the final stage. And then they lost.
"Park, look at this."
He set his tablet down on the neighboring desk.
"Project Delta, failed at 68%. Project Gamma, failed at 72%. The engine said 'yes,' but the answer was 'no.'"
Park frowned. "Is the engine broken?"
"It's not broken." The VP took a sip of coffee. "The engine ran exactly as designed. The problem is... the initial settings I fed it."
He thought back to six months ago. When the system was first deployed, he had personally set the stage weights (T-values) and signal sensitivity (k-value) for each sales stage. Based on what? Twenty years of experience and 'feel.'
T-value for Discovery: 0.3. Qualification: 0.6. Solution-Fit: 0.8.
Those numbers were sculptures carved by his intuition. And at the time, they were the best he had.
But now, over 100 historical deals sat in the system. Fifty wins and fifty losses — the most honest textbook, with clear patterns of success and failure etched into its pages. Yet the engine was still running on parameters set by 'feel' six months ago.
It was like driving a car for over a year with the side mirrors still at the angle the dealer set at delivery. You can drive. But there are blind spots.
"What if the T-values and k-value we set don't actually match the real data?"
Park nodded. "But... how do we find the right values? There are thousands of combinations."
The VP touched the screen. On the left side of the dashboard, a button had appeared — one that wasn't there six months ago. A soft purple glow, an unfamiliar icon.
[Auto-Tuner]
Chapter 2. Three Thousand Crossroads — Grid Search
He tapped the button, and the screen dimmed as a new interface opened. A simple message appeared in the center.
Auto-Tuner learns from your historical sales data to calculate optimal Bayesian parameters. 106 accumulated deals detected. Would you like to begin optimization?
He pressed [Start] without hesitation.
The first phase fired up. A grid unfolded on screen. Like an aerial photograph of Seoul's city blocks, thousands of dots filled a dense two-dimensional plane.
Phase 1: Grid Search — Scanning for Optimal Parameters
Scanning: 3,240 T/k parameter combinations
"What is this?" Park asked.
The VP read the description. Grid Search. The system was methodically scanning every possible combination of T-values (stage weights) and k-value (signal sensitivity). Like sweeping a beach with a metal detector, centimeter by centimeter, searching for the sweet spot.
The dots on the grid began changing color one by one. Blue for low accuracy. Green for moderate. The redder, the higher the accuracy. On one side of the screen, a metric called Youden's J Index was ticking in real time.
"What's the J Index?"
The VP pointed to the tooltip on screen.
"It's the sum of the ability to correctly identify 'real wins' (Sensitivity) and the ability to filter out 'non-wins' (Specificity). It finds the parameter combination that maximizes both simultaneously."
On the grid, one region began glowing an intense red. Among the 3,240 combinations, the math was pointing right there.
Thirty seconds. That's how long Grid Search took to find the 'optimal candidate.'
Grid Search Complete
Optimal candidate: T(Discovery)=0.22, T(Qualification)=0.51, T(Solution-Fit)=0.87, k=1.34
Youden's J = 0.74
Proceeding to Phase 2.
The VP compared the numbers. His gut-set T(Discovery)=0.30 from six months ago versus the data-derived 0.22. The implication was clear.
"I was overvaluing Discovery. When we got a good response in the initial meeting, I'd get excited — 'this one's a winner.' But the data is saying — reactions in the Discovery stage contribute far less to actual wins than I thought."
Conversely, the Solution-Fit stage weight rose from 0.80 to 0.87. The signal from technical validation was the decisive factor in winning — a fact proven by 100 deals.
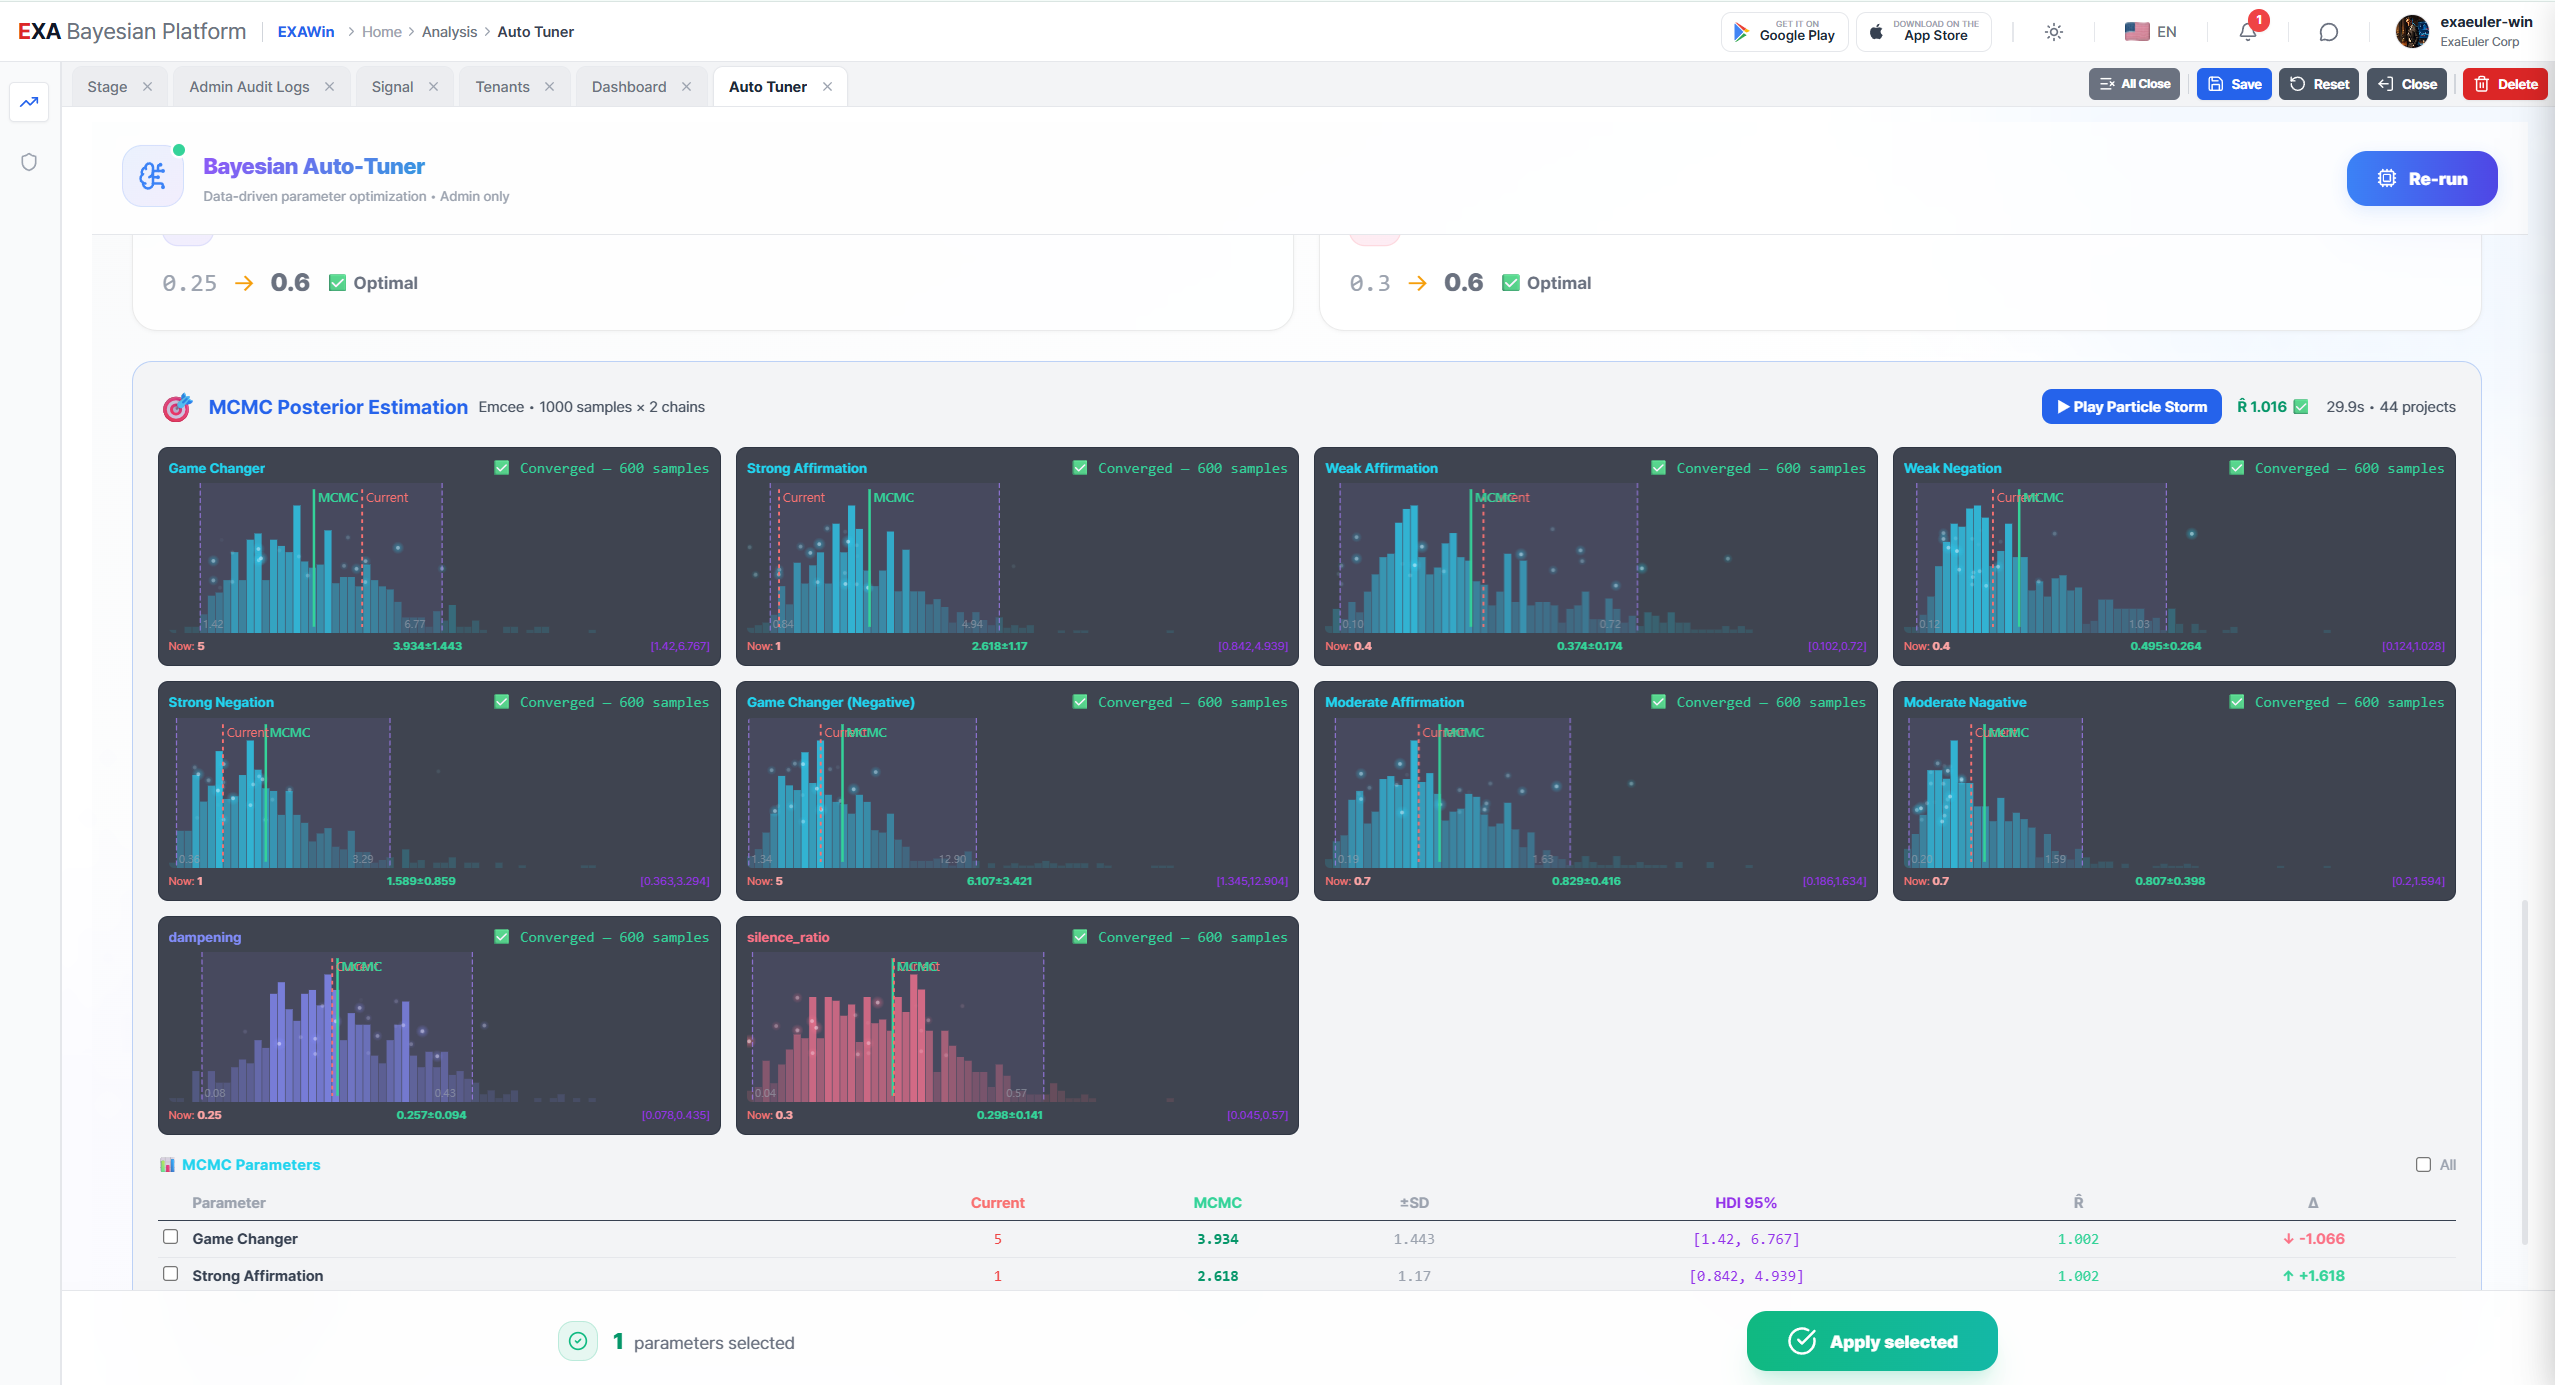
Chapter 3. The Particle Storm — MCMC Ensemble Sampling
But Grid Search was only the beginning. The screen transitioned, and the second phase opened.
Phase 2: MCMC Ensemble Sampling — Posterior Distribution Inference
Emcee Ensemble Sampler activated. Walkers: 256
The screen went dark, and hundreds of luminous particles scattered across the display. It looked like hundreds of fireflies launching into the night sky all at once.
"What's this now?" asked Kim, who had drifted over.
"MCMC. Markov Chain Monte Carlo." The VP read aloud. "Hundreds of 'walkers' explore the parameter space simultaneously. If Grid Search found 'the single best point,' this verifies 'how certain that point actually is.'"
The particles began to move. At first, it looked chaotic. Some drifted up, others down, scattering in every direction. But as time passed, a pattern emerged. The particles were slowly converging toward a single region.
"See that? They're gathering somewhere."
Where Park pointed, the particle density was thickening. Like a stellar nebula where stars are born, hundreds of trajectories spiraled into a single center.
Numbers appeared at the bottom of the screen.
Convergence Diagnostic (R-hat)
T(Discovery): R̂ = 1.002
T(Qualification): R̂ = 1.004
T(Solution-Fit): R̂ = 1.001
k: R̂ = 1.003
"What's good about R-hat being in the 1.00 range?"
The VP smiled. "It means the math is certifying 'you can trust these results.' 256 explorers entered from completely different paths, and they all arrived at the same treasure. Not one or two — all 256 reached consensus."
And that was the crux of the process. If Grid Search told you "this hill is the tallest," MCMC confirmed "and the height of this hill is precisely 87.3 meters, guaranteed with 95% confidence."
The final results appeared on screen.
HDI 95% Credible Interval
T(Discovery): 0.19 – 0.25 (Optimal: 0.22)
T(Solution-Fit): 0.83 – 0.91 (Optimal: 0.87)
k: 1.28 – 1.41 (Optimal: 1.34)
"A credible interval..." the VP murmured.
It wasn't just a single 'answer' — it was a 'range of answers.' The optimal T(Discovery) was 0.22, but anywhere between 0.19 and 0.25 was safe with 95% probability. The engine didn't insist on one answer; it showed the 'trustworthy range.' That was the decisive weight of confidence that MCMC layered on top of Grid Search.
Chapter 4. The Mirror — Cross-Validation
When the third phase began, the screen's tone shifted. From warm purple to cool teal. It felt like the lights in an operating room.
Phase 3: 5-Fold Cross-Validation — Overfitting Check
"Overfitting?" Kim tilted his head.
The VP explained. "Imagine a student who memorized the exam answers and scored 100, versus one who truly understood the material and scored 80. Overfitting is the former. Parameters over-tailored to past data might actually fail on new deals."
The system split the 106 deals into five groups (Folds). It trained on four and tested on the remaining one. This process was repeated five times. Like a clinical trial in medicine — verifying whether the same drug works on different patient groups.
Cross-Validation Results
Fold 1: Accuracy 76.2%
Fold 2: Accuracy 74.8%
Fold 3: Accuracy 73.9%
Fold 4: Accuracy 77.1%
Fold 5: Accuracy 75.4%
Mean Accuracy: 75.5% (±1.2%)
✅ No overfitting detected — Generalization performance is solid
The variance was a mere 1.2%. No matter which data fold was held out, the performance remained nearly identical. Evidence that the engine hadn't 'overfit' to the past.
But the real twist came next.
Signal Lift Analysis — Contribution by Signal
A bar chart appeared on screen. The 12 signals registered in the system were listed, each one's contribution to win probability shown by color and height.
"Look at this."
Park pointed at the screen. The bar for 'Competitive Intelligence Shared' was noticeably tall. Lift value: +3.2. When a customer let slip a competitor's pricing or proposal, the win probability jumped 3.2x.
Meanwhile, 'Increased Meeting Attendance' was barely off the ground. Lift value: +0.3.
"I always thought more people at meetings meant more interest..." Kim smiled sheepishly.
"That's what you'd call an 'illusion.'" The VP said. "Ten people at a meeting doesn't mean you'll close the deal. The data speaks clearly — the crowd is just spectators. The real signal is when a customer quietly shows you the competitor's hand."
And finally, the system raised one warning.
⚠️ Mismatch Alert
The signal 'Budget Approval' has a current Impact Score (2.5) that conflicts with the data-recommended value (1.7).
Over-configured parameters may generate False Positives (false hope).
"Isn't a confirmed budget basically a done deal?"
The VP shook his head. "It used to be. But lately, deals have been falling apart even after budget approval. Org restructuring, strategy pivots. The data caught that."
Chapter 5. Recalibration
All three phases — Grid Search, MCMC, Cross-Validation — were complete. The final results appeared in the center of the screen.
Auto-Tuner Optimization Complete
Data-driven parameters vs. existing parameters
| Parameter | Previous (Manual) | Optimal (Auto-Tuner) | Change |
|---|---|---|---|
| T(Discovery) | 0.30 | 0.22 | ▼ Overestimation corrected |
| T(Qualification) | 0.60 | 0.51 | ▼ Fine-tuned |
| T(Solution-Fit) | 0.80 | 0.87 | ▲ Key stage reinforced |
| T(Negotiation) | 0.90 | 0.92 | ▲ Fine-tuned |
| k (Signal Sensitivity) | 1.50 | 1.34 | ▼ Over-reactivity suppressed |
Youden's J Index: 0.52 → 0.74 (42% improvement)
Would you like to apply these parameters?
The VP scanned the numbers slowly. The comparison table laid bare the exact nature of the subtle drift he had been carrying for six months.
Overvaluing Discovery made the team feel like a deal was 'already won' after a good first meeting. Over-setting signal sensitivity (k) caused probabilities to spike on every minor positive signal. The result: deals they believed were 'in the bag' crumbled in the mid-to-late stages.
"Apply."
He pressed the button. The on-screen graphs redrew in real time. When the new parameters were retroactively applied to all 106 deals, the three failed deals (Delta, Gamma, Sigma) — which had shown 68%, 72%, and 61% — were recalculated to 45%, 38%, and 42%.
"See that?" He turned to Park. "With the new parameters, these deals never even hit 50%. The system would have flagged them as 'at risk.' We wouldn't have fallen into the optimism trap."
Epilogue. The Self-Evolving Engine
That night, alone in the office, the VP gazed at the city lights through the window.
Six months ago, he had called 80% on gut instinct alone, only to be slapped by the engine's 26.4%. He trusted the engine, and won the deal. But even that engine had been running on parameters set by 'human instinct' — a fact he only realized today.
What Auto-Tuner did was simple. It validated human-set parameters against human-generated data, and let the math find the optimal values. In the process, hidden biases — invisible to the human eye — were exposed, and data corrected them.
Grid Search scanned 3,240 possibilities to find the optimal candidate. MCMC's 256 walkers rigorously verified that candidate. 5-Fold Cross-Validation tested whether it would hold up in the future.
Three tools, answering one question:
"How closely does the world your engine sees match the real world?"
The VP closed his tablet and muttered to himself.
"Six months ago, I tuned the engine. From today, data tunes the engine. And I... I just steer in the direction it points."
Even in the darkness of a powered-off screen, hundreds of invisible particles were still moving. Waiting for the data of the next deal, preparing to draw an ever more precise map of probability.
[Technical Appendix] The Three Pillars of Auto-Tuner
Auto-Tuner operates through the collaboration of three mathematical engines.
1. Grid Search Optimization
- Systematically scans all possible combinations of stage weights (T) and signal sensitivity (k).
- Identifies the combination that maximizes Youden's J Index (Sensitivity + Specificity - 1).
- Exhaustive search across the parameter space prevents entrapment in Local Optima.
2. MCMC Ensemble Sampling (Emcee)
- Uses Goodman-Weare's Affine Invariant Ensemble Sampler.
- 256 parallel walkers explore the full landscape of the Posterior Distribution.
- R-hat convergence diagnostics certify result reliability; HDI (Highest Density Interval) provides 95% credible intervals.
3. 5-Fold Cross-Validation & Diagnostics
- Splits data into five folds, alternating between training and validation.
- Signal Lift analysis measures the real contribution of each signal.
- Mismatch Alerts flag discrepancies between user-configured values and data-derived optima.
📡 Next Episodes
BA025. Finding the Optimal Boundary — The Math of Grid Search and Youden's J
On a grid of 3,240 points, how does the engine find the optimal boundary between 'deals that will close' and 'deals that won't'? The tug-of-war between Sensitivity and Specificity, the sweet spot on the ROC curve, and the mathematical principles behind Youden's J Index tuning sales parameters.
BA026. Consensus of the Particles — The Math of MCMC Ensembles and Cross-Validation
Why exactly 256 walkers explore the Posterior Distribution with the Emcee algorithm. What R̂ convergence diagnostics guarantee. And how 5-Fold Cross-Validation exorcises the specter of overfitting. If the story asked 'why,' these two episodes answer 'how.'
Bayesian EXAWin-Rate Forecaster
Precisely predict sales success by real-time Bayesian updates of subtle signals from every negotiation. With EXAWin, sales evolves from intuition into the ultimate data science.


![[BA03. On-Time Risk: Appendix 1] Anatomy of the EXA Bayesian Engine: Mixture Distributions and Observational Deviation](/_next/image?url=%2Fstatic%2Fimages%2FBA03_1.png&w=3840&q=75)